[Plugin] Performance profiler

Profiler 2.11.1 is released!
  • Fixed crash with long scripts, no need for LSE builds anymore!
  • Improved performance of native functions
Download
Reply

I saw that you solved the crash with long scripts and I decided to try it, as I am obsessed with the performance, but it is crashing me after the gamemode is loaded:
Код:
[13/09/2014 00:15:24] [debug] Server crashed due to an unknown error
[13/09/2014 00:15:24] [debug] Native backtrace:
[debug] #0 f740666b in _ZN10StackTraceC1EPv () from plugins/crashdetect.so
[debug] #1 f73ff5bf in _ZN11CrashDetect20PrintNativeBacktraceERSoPv () from plugins/crashdetect.so
[debug] #2 f74008fc in _ZN11CrashDetect20PrintNativeBacktraceEPv () from plugins/crashdetect.so
[debug] #3 f74013e6 in _ZN11CrashDetect11OnExceptionEPv () from plugins/crashdetect.so
[debug] #4 f74062bc in ?? () from plugins/crashdetect.so
[debug] #5 f772b410 in ?? ()
[debug] #6 f61fba1d in _ZN7amxprof9CallGraph9AddCalleeEPNS_18FunctionStatisticsE () from plugins/profiler.so
[debug] #7 f61f7abf in _ZN7amxprof8Profiler8ExecHookEPiiPFiP6tagAMXS1_iE () from plugins/profiler.so
[debug] #8 f61f20eb in _ZN5hooks8amx_ExecEP6tagAMXPii () from plugins/profiler.so
[debug] #9 f62da4e1 in amx_Exec () from plugins/timerfix.so
[debug] #10 f62db84c in _Z12executeTimerP5timer () from plugins/timerfix.so
[debug] #11 f62db8cc in ProcessTick () from plugins/timerfix.so
[debug] #12 080cf9f2 in ?? () from samp03svr
[debug] #13 080ad
I have no idea what all these are. It is crashing me on my host, on linux, but on my computer (Windows) it isn't crashing.
Reply

Код:
Type          Name                           Calls       Self Time      Total Time

normal	unknown@0000032c	   -1857098839  	29.41	           12.38
how to find name of this function unknown@0000032c

I compiled my gamemode with -d3
Reply

Are you using the latest version of profiler? (your output doesn't look like it)
Reply

Yes, I use latest version of profiler


Reply

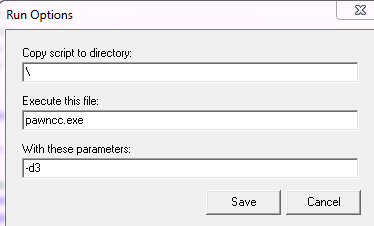
OK. But adding compile flags in pawno settings doesn't really work, that's why you have to put them in pawn.cfg as described here:

https://github.com/Zeex/samp-plugin-...ith-debug-info

Edit:

The negative number of calls is weird though. Is it possible that you're calling some function 2 billion times?
Reply

Quote:
Originally Posted by xeeZ
Посмотреть сообщение
OK. But adding compile flags in pawno settings doesn't really work, that's why you have to put them in pawn.cfg as described here:

https://github.com/Zeex/samp-plugin-...ith-debug-info
Thanks you it's work, I confused settings.ini and pawn.cfg ^^

Quote:
Originally Posted by xeeZ
Посмотреть сообщение
Edit:

The negative number of calls is weird though. Is it possible that you're calling some function 2 billion times?
I don't know but I think it's timer
Reply

It started working after like 20 server restarts.. Sorry to bother you guys..
Reply

Quote:
Originally Posted by Tika Spic
View Post
It started working after like 20 server restarts.. Sorry to bother you guys..
And why did it start working just then and not before? did you do something differently that time?
Reply

Profiler 2.12.1 is released!
  • Fixed uknown/wrong entries in stats if code modifies frame pointer via #emit sctrl
  • Added partial support for AMX_PATH variable (currently works only for paths inside gamemodes/filterscripts)
Download
Reply

Sorry for this noobish question, but how can I use this plugin?
Reply

On what pole it is necessary to sort to hear the load?

"Overall" , "Worst" ,"Self Time" , "Total Time"?
Reply

Most of the time you want to sort by "Self Time". This post explains what each column means:

http://forum.sa-mp.com/showpost.php?...&postcount=246

Edit:

Create a wiki page regarding the terminology:

https://github.com/Zeex/samp-plugin-...ki/Terminology
Reply

Beside me on linux server always empty log. After start mode I do Profiler_Stop. And on afterwards on command start Profiler_Start and stop Profiler_Stop(); Profiler_Dump(); And get file by size 1952 formats html. Version latest. On Windows work normal.

UPD
On linux profiler_GetState() always is PROFILER_STARTING (2)

UPD
Update plugin streamer on version 2.7 work normal. On version 2.7.4 not work (On linux profiler_GetState() always is PROFILER_STARTING (2)
)

Fix
Change server.cfg
plugin sscanf.so mysql.so profiler.so streamer.so

if streamer.so in end work normal if profiler.so in end not work normal
Reply

Please help me please please

https://sampforum.blast.hk/showthread.php?tid=574069
Reply

Are there any memory profilers?

A plugin to monitor memory usage and where it is used for what function etc. would be pretty handy.
Reply

https://github.com/Zeex/samp-plugin-profiler/issues/18

Can someone help with that? If not, can someone build it on windows for me with pdb file?
Reply

There's an AppVeyor debug build you can download here: https://ci.appveyor.com/project/Zeex...ld/8/artifacts
Reply

Oh, neat, missed that
Reply

Hey guys, could you explain to me the difference in self time and total time of a function? and is it in seconds? I have a query where worst time in self time is: 25655.4 and a timer that total time worst is: 38342.8, but self time is reasonable. What is aproxximately bad or laggy for server? Thank you.
Reply


Forum Jump:


Users browsing this thread: 6 Guest(s)