[Plugin] Performance profiler - Printable Version
+- SA-MP Forums Archive (https://sampforum.blast.hk)
+-- Forum: SA-MP Scripting and Plugins (https://sampforum.blast.hk/forumdisplay.php?fid=8)
+--- Forum: Plugin Development (https://sampforum.blast.hk/forumdisplay.php?fid=18)
+--- Thread: [Plugin] Performance profiler (/showthread.php?tid=271129)
+- SA-MP Forums Archive (https://sampforum.blast.hk)
+-- Forum: SA-MP Scripting and Plugins (https://sampforum.blast.hk/forumdisplay.php?fid=8)
+--- Forum: Plugin Development (https://sampforum.blast.hk/forumdisplay.php?fid=18)
+--- Thread: [Plugin] Performance profiler (/showthread.php?tid=271129)
Re: Performance profiler - xeeZ - 31.08.2014
Profiler 2.11.1 is released!
- Fixed crash with long scripts, no need for LSE builds anymore!
- Improved performance of native functions
Re: Performance profiler - IstuntmanI - 12.09.2014
I saw that you solved the crash with long scripts and I decided to try it, as I am obsessed with the performance, but it is crashing me after the gamemode is loaded:
Код:
[13/09/2014 00:15:24] [debug] Server crashed due to an unknown error
[13/09/2014 00:15:24] [debug] Native backtrace:
[debug] #0 f740666b in _ZN10StackTraceC1EPv () from plugins/crashdetect.so
[debug] #1 f73ff5bf in _ZN11CrashDetect20PrintNativeBacktraceERSoPv () from plugins/crashdetect.so
[debug] #2 f74008fc in _ZN11CrashDetect20PrintNativeBacktraceEPv () from plugins/crashdetect.so
[debug] #3 f74013e6 in _ZN11CrashDetect11OnExceptionEPv () from plugins/crashdetect.so
[debug] #4 f74062bc in ?? () from plugins/crashdetect.so
[debug] #5 f772b410 in ?? ()
[debug] #6 f61fba1d in _ZN7amxprof9CallGraph9AddCalleeEPNS_18FunctionStatisticsE () from plugins/profiler.so
[debug] #7 f61f7abf in _ZN7amxprof8Profiler8ExecHookEPiiPFiP6tagAMXS1_iE () from plugins/profiler.so
[debug] #8 f61f20eb in _ZN5hooks8amx_ExecEP6tagAMXPii () from plugins/profiler.so
[debug] #9 f62da4e1 in amx_Exec () from plugins/timerfix.so
[debug] #10 f62db84c in _Z12executeTimerP5timer () from plugins/timerfix.so
[debug] #11 f62db8cc in ProcessTick () from plugins/timerfix.so
[debug] #12 080cf9f2 in ?? () from samp03svr
[debug] #13 080ad
Re : Re: Performance profiler - halil69 - 01.10.2014
Код:
Type          Name                           Calls       Self Time      Total Time

normal	unknown@0000032c	   -1857098839  	29.41	           12.38
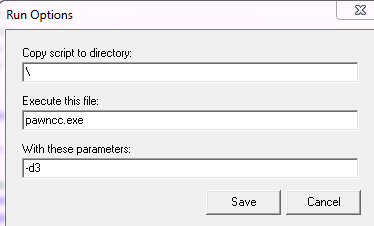
I compiled my gamemode with -d3
Re: Performance profiler - xeeZ - 01.10.2014
Are you using the latest version of profiler? (your output doesn't look like it)
Re : Performance profiler - halil69 - 01.10.2014
Yes, I use latest version of profiler


Re: Performance profiler - xeeZ - 01.10.2014
OK. But adding compile flags in pawno settings doesn't really work, that's why you have to put them in pawn.cfg as described here:
https://github.com/Zeex/samp-plugin-...ith-debug-info
Edit:
The negative number of calls is weird though. Is it possible that you're calling some function 2 billion times?
Re : Re: Performance profiler - halil69 - 02.10.2014
Quote:
|
OK. But adding compile flags in pawno settings doesn't really work, that's why you have to put them in pawn.cfg as described here:
https://github.com/Zeex/samp-plugin-...ith-debug-info |
Quote:
|
Edit:
The negative number of calls is weird though. Is it possible that you're calling some function 2 billion times? |
Re: Performance profiler - Tika Spic - 08.01.2015
It started working after like 20 server restarts.. Sorry to bother you guys..
Respuesta: Re: Performance profiler - Gryphus One - 11.01.2015
Quote:
|
It started working after like 20 server restarts.. Sorry to bother you guys..
|
Re: Performance profiler - xeeZ - 11.01.2015
Profiler 2.12.1 is released!
- Fixed uknown/wrong entries in stats if code modifies frame pointer via #emit sctrl
- Added partial support for AMX_PATH variable (currently works only for paths inside gamemodes/filterscripts)
Re: Performance profiler - Youssef221 - 27.01.2015
Sorry for this noobish question, but how can I use this plugin?
Re: Performance profiler - cm666 - 18.02.2015
On what pole it is necessary to sort to hear the load?
"Overall" , "Worst" ,"Self Time" , "Total Time"?
Re: Performance profiler - xeeZ - 18.02.2015
Most of the time you want to sort by "Self Time". This post explains what each column means:
http://forum.sa-mp.com/showpost.php?...&postcount=246
Edit:
Create a wiki page regarding the terminology:
https://github.com/Zeex/samp-plugin-...ki/Terminology
Re: Performance profiler - cm666 - 21.02.2015
Beside me on linux server always empty log. After start mode I do Profiler_Stop. And on afterwards on command start Profiler_Start and stop Profiler_Stop(); Profiler_Dump(); And get file by size 1952 formats html. Version latest. On Windows work normal.
UPD
On linux profiler_GetState() always is PROFILER_STARTING (2)
UPD
Update plugin streamer on version 2.7 work normal. On version 2.7.4 not work (On linux profiler_GetState() always is PROFILER_STARTING (2)
)
Fix
Change server.cfg
plugin sscanf.so mysql.so profiler.so streamer.so
if streamer.so in end work normal if profiler.so in end not work normal
Re: Performance profiler - perfectboy - 13.05.2015
Please help me please please
https://sampforum.blast.hk/showthread.php?tid=574069
Re: Performance profiler - Tamer - 23.05.2015
Are there any memory profilers?
A plugin to monitor memory usage and where it is used for what function etc. would be pretty handy.
Re: Performance profiler - Misiur - 30.06.2015
https://github.com/Zeex/samp-plugin-profiler/issues/18
Can someone help with that? If not, can someone build it on windows for me with pdb file?
Re: Performance profiler - maddinat0r - 30.06.2015
There's an AppVeyor debug build you can download here: https://ci.appveyor.com/project/Zeex...ld/8/artifacts
Re: Performance profiler - Misiur - 30.06.2015
Oh, neat, missed that
Re: Performance profiler - Type-R - 17.03.2016
Hey guys, could you explain to me the difference in self time and total time of a function? and is it in seconds? I have a query where worst time in self time is: 25655.4 and a timer that total time worst is: 38342.8, but self time is reasonable. What is aproxximately bad or laggy for server? Thank you.

